Using the Big Cities Health Inventory to Examine Obesity and City Environment in Select U.S. Cities
The BCHI data platform is primarily funded by the U.S. Centers for Disease Control and Prevention through a cooperative agreement with the National Association of County and City Health Officials. The views expressed in this brief do not necessarily represent the views of the funders.
Download the Brief
Overview
Over the past 20 years, the prevalence of adult obesity in the U.S. has increased two-fold from below 15% in 1990 to 31% by 2019 and nationwide, is expected to reach a staggering 50% by 2030.1 Public health concerns regarding obesity stem from it being one of the strongest risk factors for numerous morbidities including Type 2 diabetes, hypertension, heart disease, many types of cancers and osteoarthritis.
Public health agencies acknowledge that this rapid rise in obesity prevalence has been due to rapid changes in environmental conditions that have fueled consumption of higher calories and highly processed foods and beverages,
as well as increased sedentary behaviors. Multiple domains of our environment are implicated in promoting obesity and discouraging weight loss; often cited are the inter-connected domains of natural and built environments, and economic and policy environments.2
The Big Cities Health Coalition (BCHC) is a forum for the lead health officials of the nation’s largest metropolitan health departments to exchange strategies and jointly address issues to promote the health and safety of the 62 million people they serve. This brief uses data from the Big Cities Health Inventory (BCHI) data platform. The platform includes over 100 metrics related to health and allows for comparison of metrics across BCHC member jurisdictions (currently 29 cities) which are among the country’s largest, most urban cities. Visitors to the data platform can explore metrics, view data charts by city or select multiple cities for comparison, and download charts and data. Visit the BCHI data platform (bigcitieshealthdata.org) to learn more.
Metrics from the BCHI Data Platform
Using data available in the BCHI data platform, we describe the prevalence of obesity and city barriers to reducing city prevalence of obesity: 1) less favorable natural and built environments, 2) higher poverty and less healthcare access, and 3) physical inactivity and lower dietary quality, see Figure 1. We used two obesity metrics (adult and teen obesity), ve city environment metrics related to natural and built environment, and two city metrics related to poverty and lower healthcare access (health insurance). We examined health behavior metrics to confirm expected linkages between city obesity and city physical inactivity and lower quality diet.
Figure 1: Conceptual diagram of domains related to city obesity prevalence.

Findings from the BCHI Data Platform
In recent years, adult obesity prevalence in BCHC cities slightly increased (median 27% to median 30% between 2014 and 2019) and teen obesity prevalence was roughly stable at 15.5%. CDC's Healthy People 2020 goals are that, by year 2020, adult obesity would not exceed 30.5% and teen obesity would not exceed 14.5%. The majority of BCHC cities have met Healthy People 2020 goals.
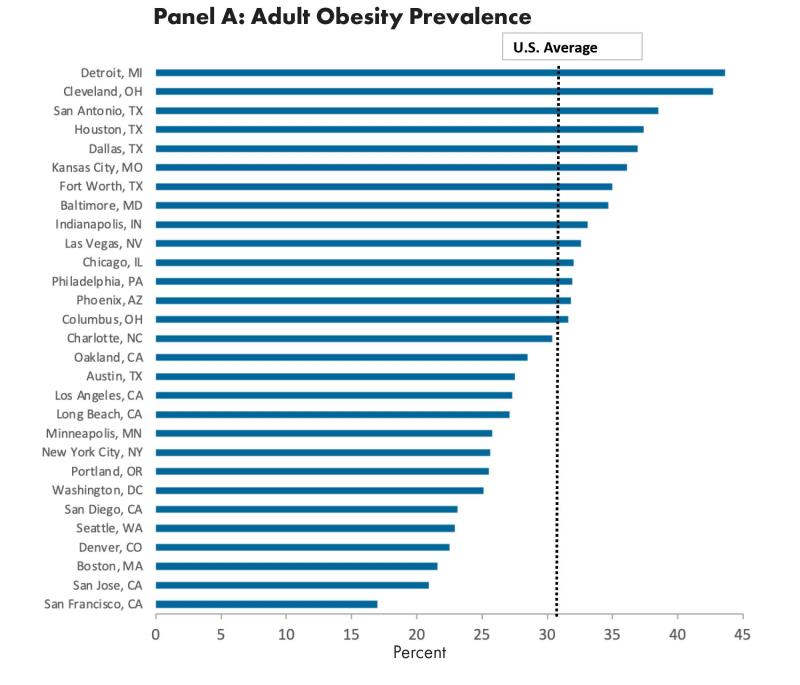
However, obesity prevalence varied substantially between cities. As shown in Figure 2, adult obesity ranged from 17% to 43.6% (Panel A) and teen obesity ranged from 7.7% to 22.1% (Panel B), data are available for only 19 BCHC cities.
Figure 2: Obesity prevalence in BCHC cities, 2019, in adults (panel A) and teens (panel B).

As expected, adult and teen inactivity and poor dietary quality roughly align with city obesity prevalence (data not shown in figure). On average, mean obesity was approximately 6 percentage points higher for cities with higher prevalence of teen inactivity/poor dietary quality (12.6% versus 18.3%) and 10 percentage points higher for cities with higher prevalence of adult inactivity (25.1% versus 35.1%). For further details, see the online supplement that accompanies this brief.
Natural and Built Environment
Cities with less favorable natural and built environment had higher adult obesity and teen obesity, with the pattern strongest for adult obesity. As shown in Figure 3, adult obesity was approximately 7 percentage points higher for cities with less favorable natural and built environment compared to cities with better natural and built environment (26.4% versus 33.7%). Average teen obesity was 1 percentage points higher (15% versus 16.2%).
Figure 3: Percent of adult and teen obesity for above- and below-average metric values for city natural and built environment (panel A, a composite measure based on lower city park investment, greenspace, walkability, bike ability, supermarket access); and city poverty and healthcare access (panel B, a composite measure based on higher city poverty and higher proportion without health insurance).

Poverty and Uninsured
Across BCHC cities, the average proportion of residents who were poor/"near poor"(≤200% of the federal poverty level) was roughly similar to the U.S. as a whole (U.S. 31%, BCHC cities 36%) but varied substantially between cities (ranged 21% to 61%). Similarly, the proportion of residents without health insurance was similar to the U.S. overall (U.S. 8.8%, BCHC cities 8.5%) but ranged from 3.5% to 24%. Cities with higher poverty and uninsured had higher adult obesity (25.5% vs. 35%) and teen obesity (12.8% vs. 18.5%).
Obesity and City Environments
Lowering and preventing increases in city obesity prevalence will be a significant challenge for all cities. Using data from the data platform, we can cross-classify metrics in order to identify cities that will likely face more obstacles to curtailing obesity.

Figure 4: Adult obesity prevalence, by city poverty and uninsured. The BCHC cities are classified according to whether they have below- or above-average adult obesity prevalence, uninsured, and poverty and ”near poor” (≤200% of federal poverty level). Cities in green text indicate more favorable city natural and built environments. The figure identifies cities with the least favorable conditions for lowering obesity (Box A), cities with the most favorable conditions for lowering obesity (Box H) and cities with mixed conditions (Boxes B – G).
- Five of the BCHC cities (Box A) have above-average obesity prevalence, more poverty, more uninsured, and have less favorable natural and built environments. These cities may encounter sizable challenges in attaining obesity prevention and reduction goals.
- Ten of the higher obesity cities have mixed status (either more poverty [Box B] or more uninsured [Box C]) but three of them (in green font) have more favorable built environment which may offer some protection from further increases in obesity rates.
- Nine of the 29 cities (Box H) have below-average obesity prevalence, less poverty and less uninsured, and most of them already have a more suitable natural and built environment (in green font). These cities may encounter fewer challenges in attaining obesity prevention and reduction goals.
Note that teen obesity is only available for 19 cities in the data platform. Nevertheless, for the cities with available data, the cross-classification patterns appeared to be similar to adult obesity reported above.
Summary and Implications for BCHC
The information in the data platform can be used to inform city health priorities and potential policy actions as well as anticipate where BCHC member cities may see increases in health disparities between and within cities. In the case of obesity, data from the platform showed that cities with higher obesity tended to be more disadvantaged on multiple dimensions: poorer and more uninsured, and had natural and built environments that were less supportive of physical activity and healthier eating.
BCHC and UHC Partnership
The Big Cities Health Inventory data platform (pictured above) was developed and is maintained by the Drexel Urban Health Collaborative (UHC) at the Dornsife School of Public Health in partnership with BCHC. The UHC has partnered with BCHC to support the Coalition’s vision of healthy, more equitable cities through big city innovation and leadership. The UHC is a multidisciplinary research and practice center that leverages the power of data, research, education, and partnerships to make cities healthier, more equitable, and environmentally sustainable.
For supplemental information and figures for this brief, click here.
Citation
Auchincloss, A.,McCarver, L., Livengood, K., Niamatullah, S. (2022). Using the Big Cities Health Inventory to Examine Obesity and City Environment in Select U.S. Cities.Urban Health Collaborative.
References
1Ward ZJ, Bleich SN, Cradock AL, Barrett JL, Giles CM, Flax C, Long MW and Gortmaker SL. Projected U.S. state-level prevalence of adult obesity and severe obesity. New England Journal of Medicine. 2019;381:2440-2450. https://www.nejm.org/doi/full/10.1056/NEJMsa1909301.
2Swinburn B, Egger G and Raza F. Dissecting obesogenic environments: the development and application of a framework for identifying and prioritizing environmental interventions for obesity. Preventive Medicine. 1999;29:563-70.
https://pubmed.ncbi.nlm.nih.gov/10600438/